Vantage Points


Street-level is where the action is: hustle and bustle is the stuff of marketplaces and public squares.
But if you crave perspective, climb the stairs of a belltower or scramble to the top of a nearby hill. Because from the right vantage point, the town takes on a different shape. Sometimes, you can even see how it relates to the surrounding country.
Towns often relate to one another, too. Even when that is not the case, there are things to learn from assessing their similarities and differences. Because while it is true that each plan is unique, there are commonalities. Throughlines. They allow us to connect towns in unexpected ways, and push us to ask all kinds of questions about urban space.
Let's start with some basics. This map shows not only which towns were planned, but how many features are included on each plan. Use the first filter to see which town plans have the most features, and which have the least. Use the "type" filter to toggle between current and planned features. We highly recommend using the zoom tools, which activate when you hover in the upper left of the map.
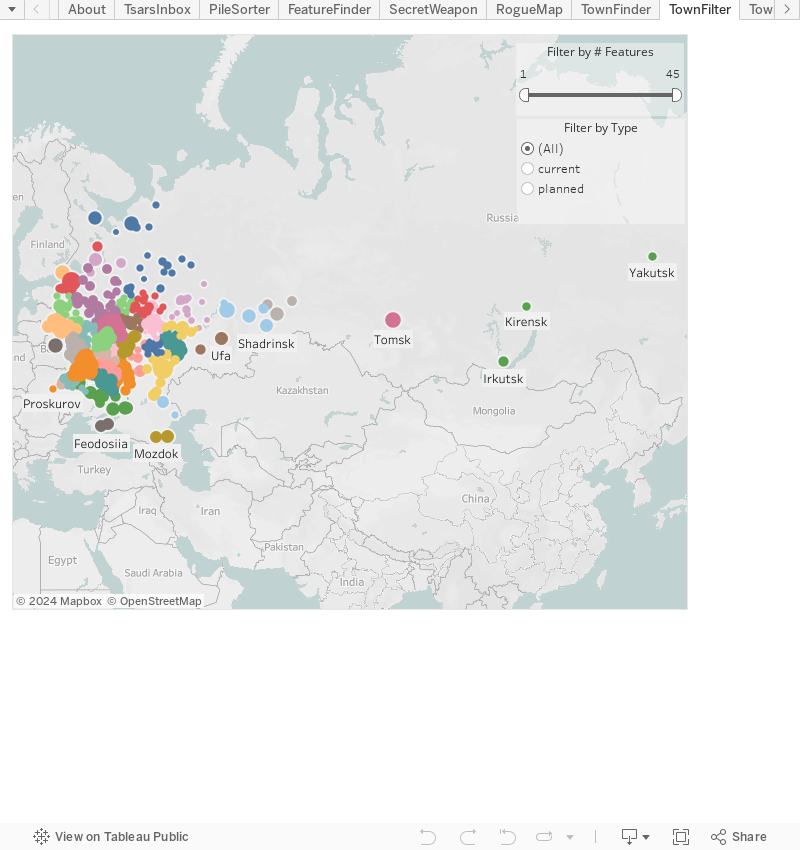
Take some time with the map. Once you are comfortable with how it works, and once you have made a few observations, here are a few metaphorical hilltops from which to view Russia's urban landscape.
The Tsar's Inbox
Information about Russian towns flowed into St. Petersburg over more than six decades. Explore our interactive timeline to learn what the tsars knew, and when they knew it.
The Pile Sorter
Not all data is created equal. Some features crop up in large numbers; others are rare. Some are named in the legends; others are described graphically. Use this filter set to identify patterns and begin compiling a list of "why?" questions.
The Feature Finder
Which towns had vodka shops? Where were the breweries? If questions like these keep you up at night, this map is for you.
The Critic's Secret Weapon
The Rogue Map
This viz explores the idea of feature diversity. Think of it this way: a town with 6 churches is less diverse than a town with 1 church, 1 granary, and 1 garden. We have assigned all towns and provinces a "diversity index" between 1 and 5. And we are setting you loose to find the boundary between the ordinary and the extra-ordinary.